Influenza Season Workforce Distribution
Statistical Analysis | Hypothesis Testing | Tableau Visualizations
Project Overview
-
Influenza season in the US increases hospitalizations for vulnerable populations.
As part of a medical staffing agency, my goal is to determine when & how many medical staff to deploy to each state to minimize deaths from influenza.
-
Population data by geography (US Census Bureau)
Counts of influenza laboratory test results by state (CDC-Fluview)
-
Data preparation (integrity, quality, transformation, integration)
Statistical analysis & Hypothesis testing
Data visualization with Tableau (time-series, histograms, scatterplots, spatial analysis)
Analysis & Key Questions
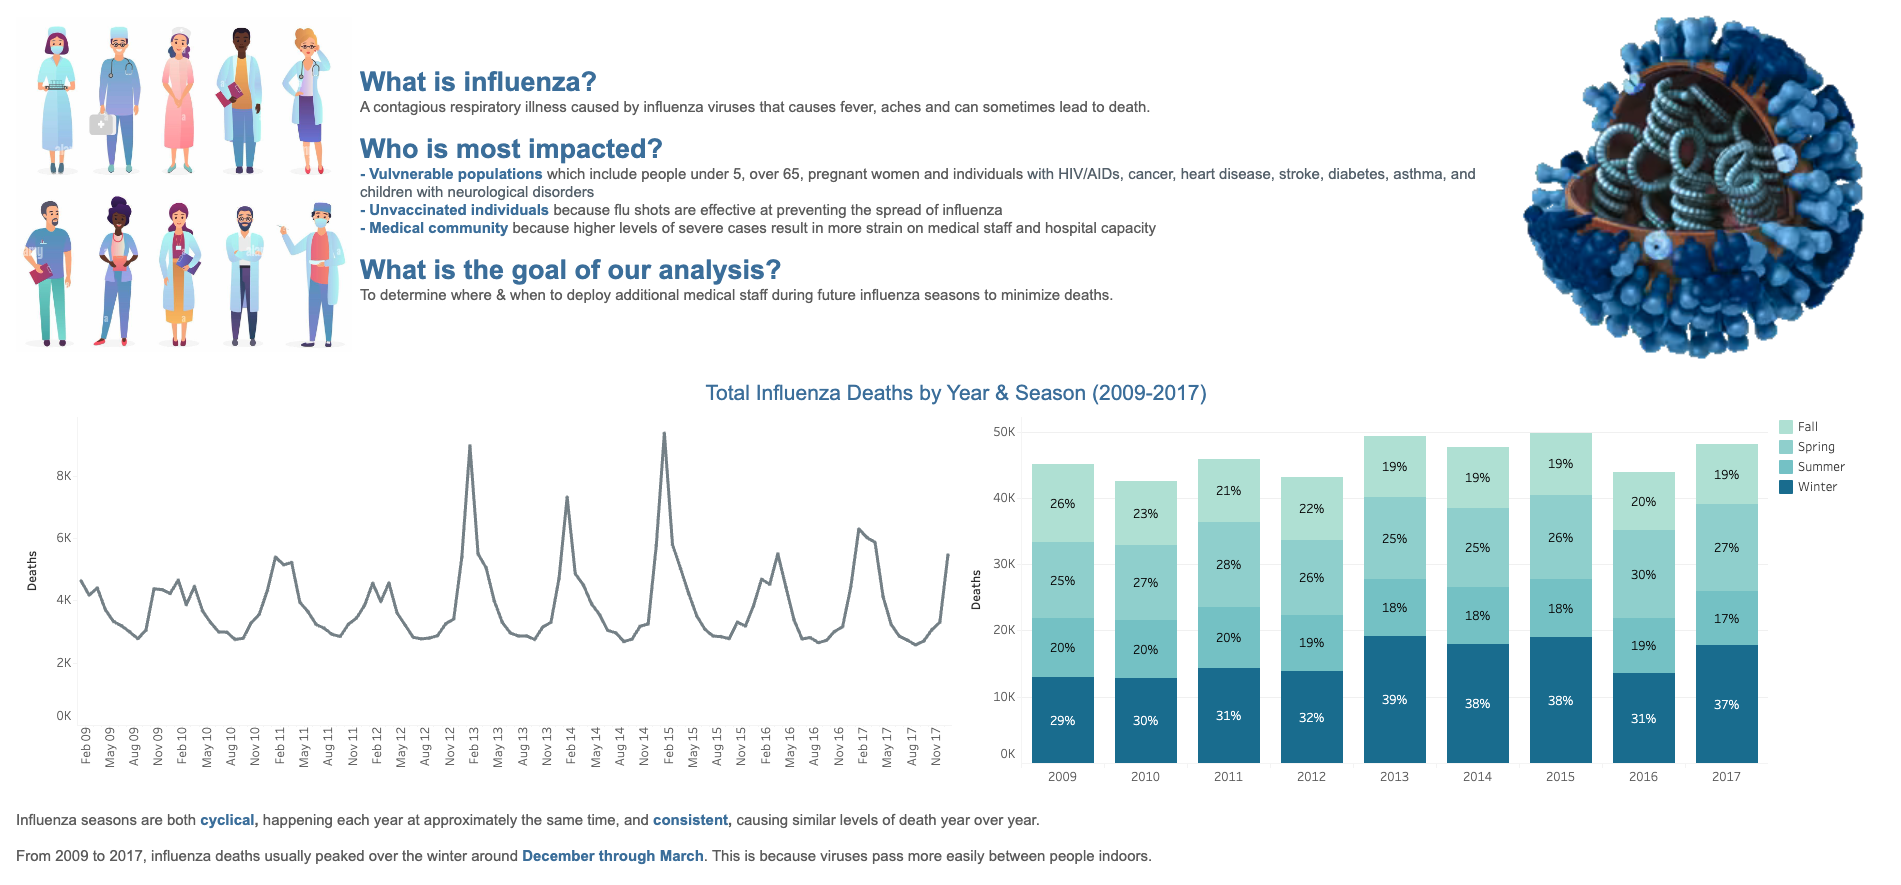
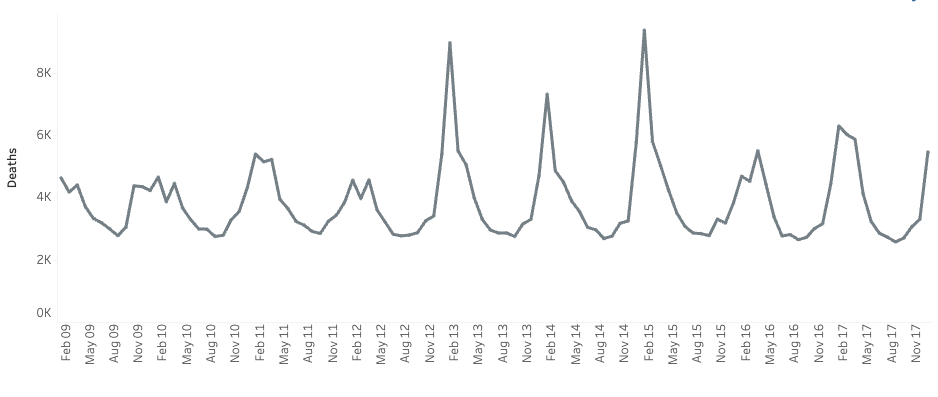
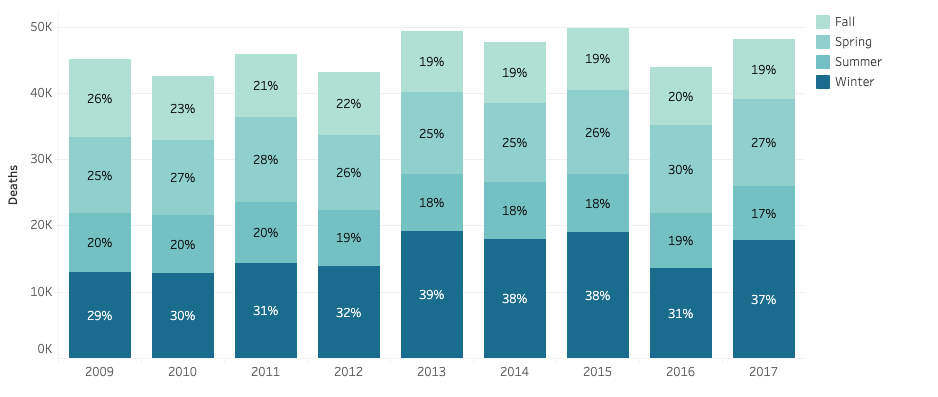
Is Influenza seasonal?
Influenza seasons are cyclical, peaking each year from December to March, and consistent, causing similar levels of death year over year.
Who is most vulnerable?
The influenza mortality rate is highest for children under 5 and adults 65 & over. This vulnerable population is where we will focus our staffing resources.
Where are deaths occurring?
States with the most total deaths are also the states with the largest vulnerable populations. The top 9 of these states where aid should be focused are California, New York, Texas, Pennsylvania, Illinois, Florida, Ohio, North Carolina, Michigan.
Conclusions
Recommendations
Workers should be deployed to the 9 states (California, Texas, Florida, New York, Pennsylvania, Illinois, Ohio, Michigan, North Carolina) with most deaths and largest vulnerable populations.
Number of staff deployed should be proportional to the size of the state's vulnerable population.
Staff should be sent in the beginning of December to mitigate against the peak of influenza season (December - March).
Next Steps
Additional analysis should be conducted to determine best course of actions for preventing and treating influenza.
Follow up analysis should be conducted to measure effectiveness of additional medical staff.


