Global Development Analysis
Python | Tableau | Linear Regression | Clustering
Project Overview
-
Fort his project, I chose a dataset of personal interest: social & economic progress around the world.
My objective is to explain the positive trend in global economic progress by correlating social and economic factors across and within global regions over the past 30 years.
-
This dataset summarizes 100 indicators affecting global development, health, and poverty. It consolidates national-level data from official sources worldwide, covering 1960-2023.
-
Supervised machine learning: regression
Unsupervised machine learning, k-means clustering
Sourcing & analyzing time-series data
Data dashboard creation
Tools: Pandas, Jupyter, GitHub, Tableau
Data Cleaning & Roadblocks
-
To introduce additional factors for analysis, I merged the primary dataset with secondary datasets for continent grouping, top religion by popularity, and income grouping by GNI per country-year combination to
I then created a data profile, checked for duplicates and missing values, and removed and renamed unnecessary or confusing columns.
-
During data cleaning, I found many missing values for a large portion of countries and years, likely due to poor data collection practices in national organizations.
These missing values would compromise correlation and regression accuracy and introduce bias. As a result, I narrowed the timeframe and restricted the analysis to a smaller set of variables.
Exploratory Analysis & Hypothesis Formulation
After exploring correlations across the wider dataset, I then identified 4 factors on which to focus my analysis on—GDP per capita, life expectancy at birth, birth rate (crude) & urban population %— and formulated a hypothesis for each correlated pair:
Hypothesis 1: As life expectancy at birth increases, GDP per capita also increases.
Hypothesis 2: As urban population % increases, birth rate decreases.
Linear Regression & Clustering
I used linear regression to test the hypothesis: As life expectancy at birth increases, GDP per capita also increases. I found that a linear relationship is a poor explanation of the data and I needed to try another approach.
Next, I conducted a cluster analysis - a statistical grouping of similar data points - which resulted in 4 distinct clusters.
Cluster Analysis
I then compared the clusters across a number of variables:
Cluster 1 had the lowest life expectancy, GDP and urban population % and the highest birth rates. This cluster represents years that skew earlier and the most under developed likely in Africa & Asia.
Cluster 2 has relatively high life expectancy, very low GDP, relatively low birth rate and moderate urban population. This cluster represents a period of high development nations concentrated in Eastern Europe, South America & Asia.
Cluster 3 has the highest levels for all statistics except birth rate for which it has the lowest. This cluster represents highly developed nations primarily in Europe & Australia.
Cluster 4 has similar but less extreme statistics to cluster 3 for all variables. This cluster represents the US & China exclusively.
Conclusions
Findings
High GDP correlates with higher life expectancy.
Increased urbanization correlates with lower birth rates.
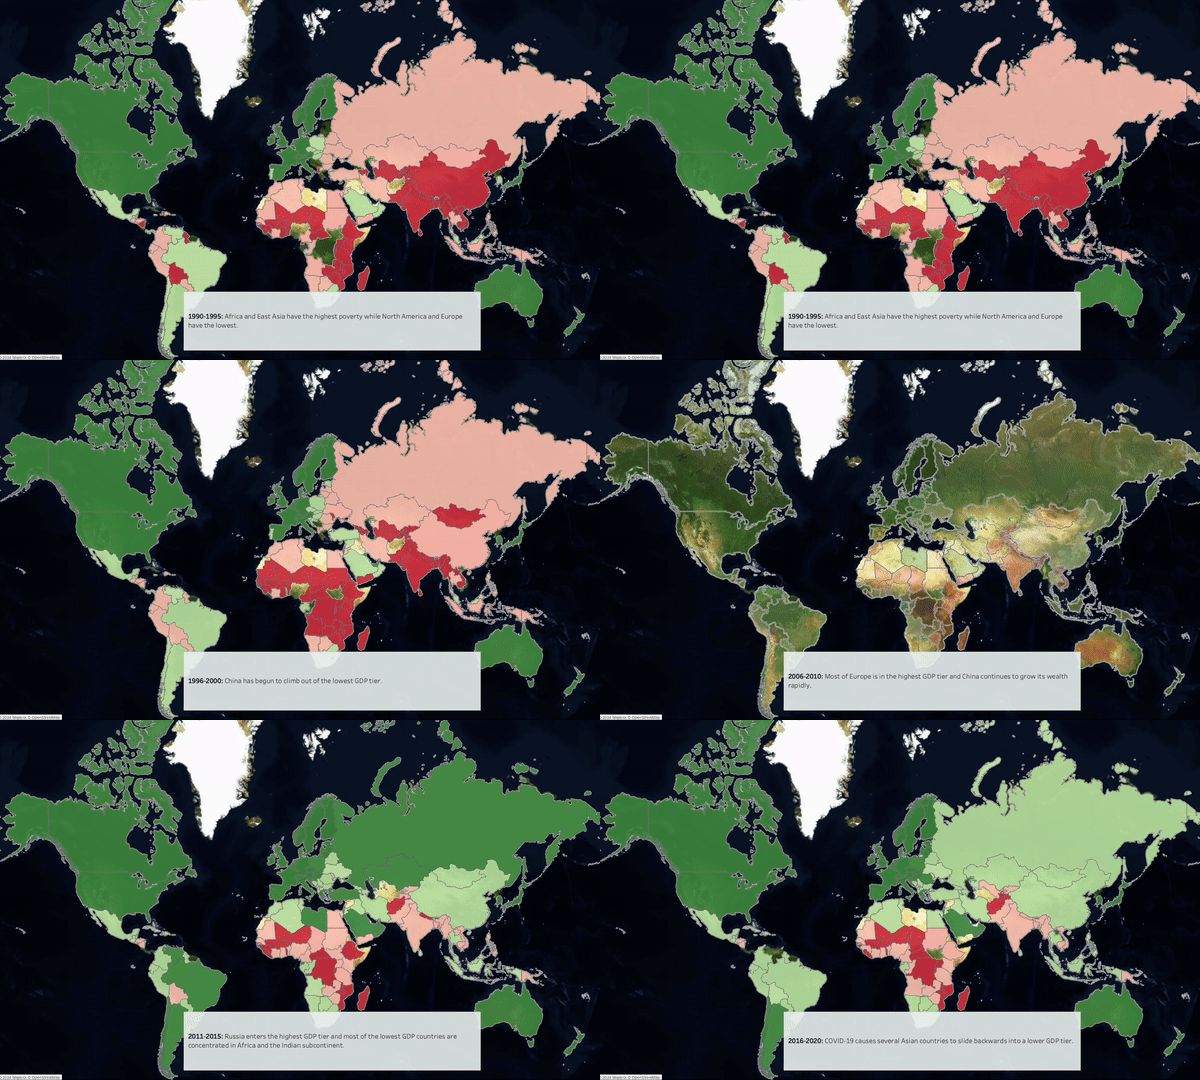
Between 1990 & 2020, overall wealth has increased however wealth growth and urbanization has been highest in Eastern & Southern Europe & East Asia.
Limitations
Many factors from the initial dataset had to removed because they had insufficient data records
The time frame (1990-2020) is too short to accurately understand long-term development trends.
Data collected from corrupt government institutions may be subject to collection bias.
Next Steps
Collect more data on social and political factors to understand their impact on public health.
Analyze post-COVID years to gain insights on pandemic preparedness.
Revisit the WDI dataset for a nuanced analysis of factors like energy consumption and individual economic growth


